
POP Module 5 - Alignment Process
Applications and Research Integration
Discover how POPs enable modern agricultural research, support farm operations, and align with NMSU's strategic vision for innovation and outreach
Learning Objectives
By the end of this module, you will be able to:
Key Performance Metrics
To demonstrate value and justify continued investment, POP infrastructure is evaluated using three primary metrics: uptime, researcher engagement, and IoT device connectivity.
Metric 1: System Uptime
Definition:
Percentage of time that POP is operational and providing connectivity. Measured as (total hours operational / total hours in period) × 100%.
Target Performance:
- Excellent: >98% uptime
- Good: 95-98% uptime
- Acceptable: 90-95% uptime
- Needs Improvement: <90% uptime
Factors Affecting Uptime:
- Battery capacity: Sufficient storage for cloudy periods
- Solar panel performance: Clean panels, proper orientation
- Wireless link stability: Good alignment, clear LOS
- Equipment reliability: Quality hardware, proper maintenance
- Weather events: Extreme conditions (storms, snow)
How Uptime is Monitored:
NMSU IT uses network monitoring tools (e.g., PRTG, Nagios) to continuously ping POPs and log connectivity status. Cerbo GX also provides power system status. Downtime events are logged with timestamps and causes.
Why Uptime Matters:
High uptime ensures researchers can rely on continuous data collection and farm staff have consistent connectivity. Even 95% uptime means ~36 hours of downtime per month—potentially missing critical events or disrupting operations. Target is >98% for research-grade reliability.
Metric 2: Researchers Connected
Definition:
Number of unique researchers, graduate students, and collaborators actively using POP connectivity for their work. Measured monthly or per semester.
Engagement Levels:
- Active users: Access data or visit site weekly
- Regular users: Access monthly
- Occasional users: Access quarterly
- Registered users: Have access but not currently active
How Engagement is Tracked:
- WiFi authentication logs (unique device MACs)
- Data portal access logs
- Researcher surveys and self-reporting
- Grant proposals citing POP infrastructure
- Publications using POP-collected data
Current Engagement Statistics (2024):
Why This Metric Matters:
The number of researchers connected demonstrates the breadth of impact and justifies infrastructure investment. Growing researcher engagement indicates successful adoption and increasing value. This metric is particularly important for legislative reporting and grant applications.
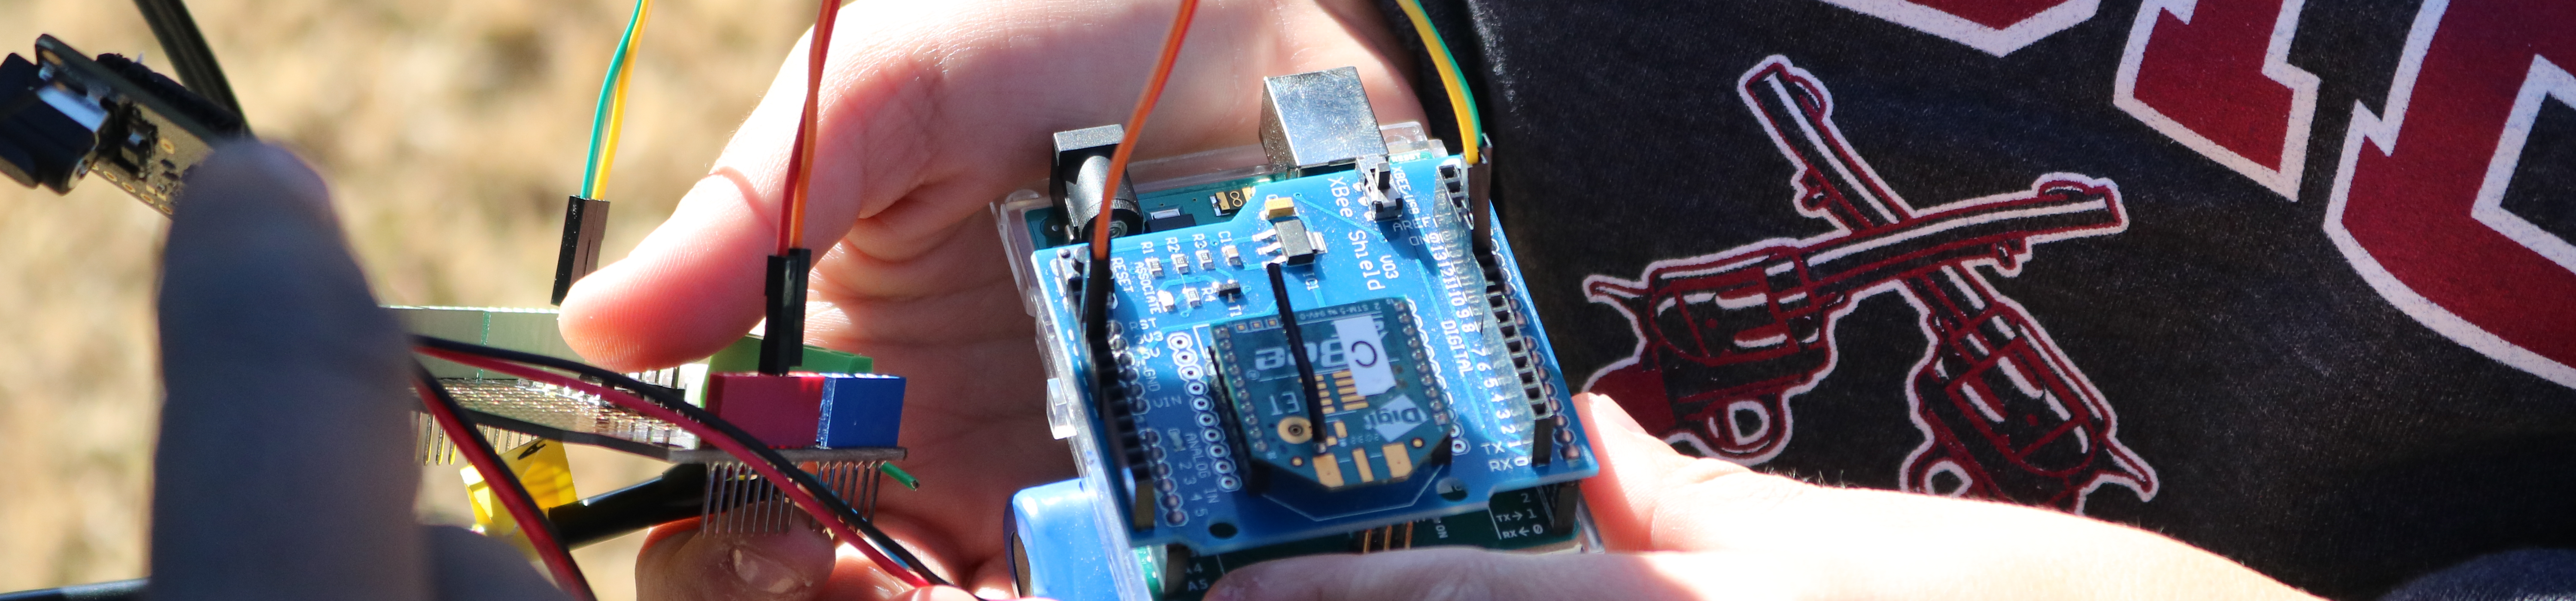
Metric 3: IoT Devices Connected
Definition:
Total number of sensors, cameras, monitoring devices, and automated systems connected to POP network. Indicates scale of data collection infrastructure.
Device Categories:
- Environmental sensors: Weather, soil, water
- Cameras: Security, time-lapse, monitoring
- Control systems: Irrigation, climate, equipment
- Tracking devices: GPS, RFID, asset tags
Typical Device Counts per POP:
- Small deployment: 5-10 devices
- Medium deployment: 10-25 devices
- Large deployment: 25-50 devices
- Research-intensive: 50+ devices
Current Device Statistics (2024):
Why This Metric Matters:
IoT device count demonstrates the scale of modern agricultural research infrastructure and the enabling role of POP connectivity. Each device represents data that was previously uncollected or required manual effort. Growing device counts show increasing adoption of precision agriculture and data-driven research methods.